Microsoft Message Analyzer
Microsoft Message Analyzer is a tool for Windows 7 and newer Windows versions that is been designed to assist users in troubleshooting and diagnostic scenarios.
The program ships with functionality to capture, list and analyze protocol traffic, e.g. http and https connections, events, as well as system or application messages.
It replaced Microsoft Network Monitor 3.4, and may be used to capture live local or remote traffic, and to load previous captures for further analysis.
Installation of the program should not pose any problems. The program displays a prompt after installation which you use to configure updating behavior and the participating in surveys.
Microsoft Message Analyzer
Please note that you need to run the program with elevated rights. Failure to do so will result in error messages and broken functionality.
The program interface is quite noisy, there is a lot going on. Microsoft Message Analyzer displays lots of links at the top, and quite a few panels in the lower half.
The program does load a start page by default which lists news and a couple of scenarios to get you started.
You may click on a scenario, local network interfaces (Win 8.1 and later) for instance, to start capturing traffic right away.
Each capture is listed in a tab in the program interface, so that you may switch between them easily.
Starting a session
You may click on New Session to start a custom session on the other hand.
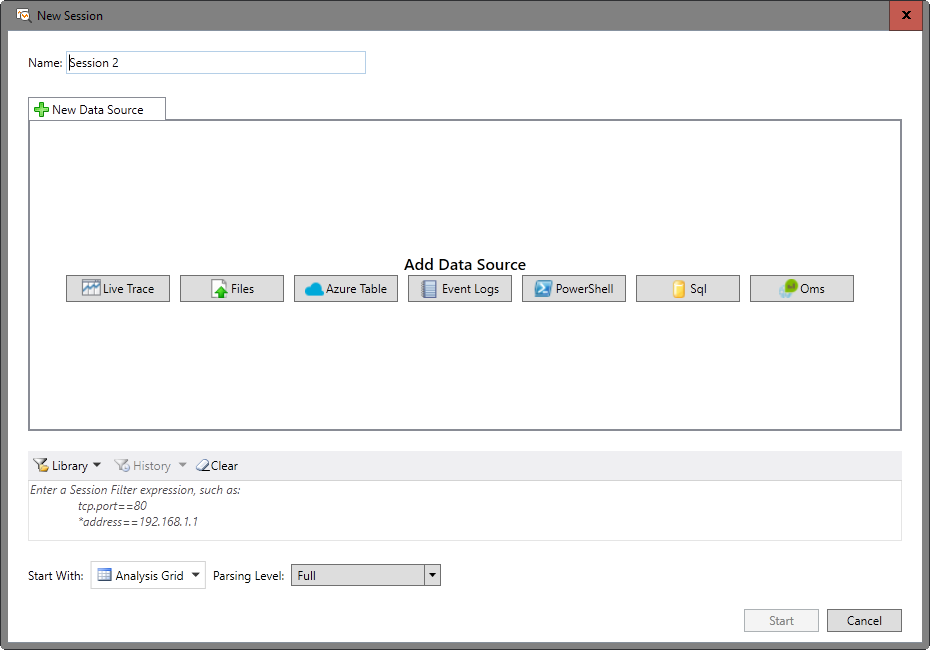
The configuration screen that opens lists data sources that you may pick one or multiple from, and a couple of options below that.
First, you may enter filters to list only matching traffic, e.g. only traffic to a specific IP address. Additionally, you may define how the data is presented to you, and the parsing level.
As far as data sources are concerned, you may start a new live trace, or use various other sources including event logs, PowerShell, SQL, or Azure Table.
The configuration screen changes once you make a data source selection. If you select Even Logs for instance, available sources are displayed to you on the next screen.
Live Trace on the other hand gives you options to pick from a selection of ETW Providers. Select VPN, Remote Network Interfaces or Pre-Encryption from a large list of options, and add custom or system providers during the step as well.
You may add multiple data sources to a session. Once you are done configuring the session, hit start to run it.
You get the usual controls to pause or stop the capturing, and save the data so that it can be loaded again at a later point in time or moved to another system.
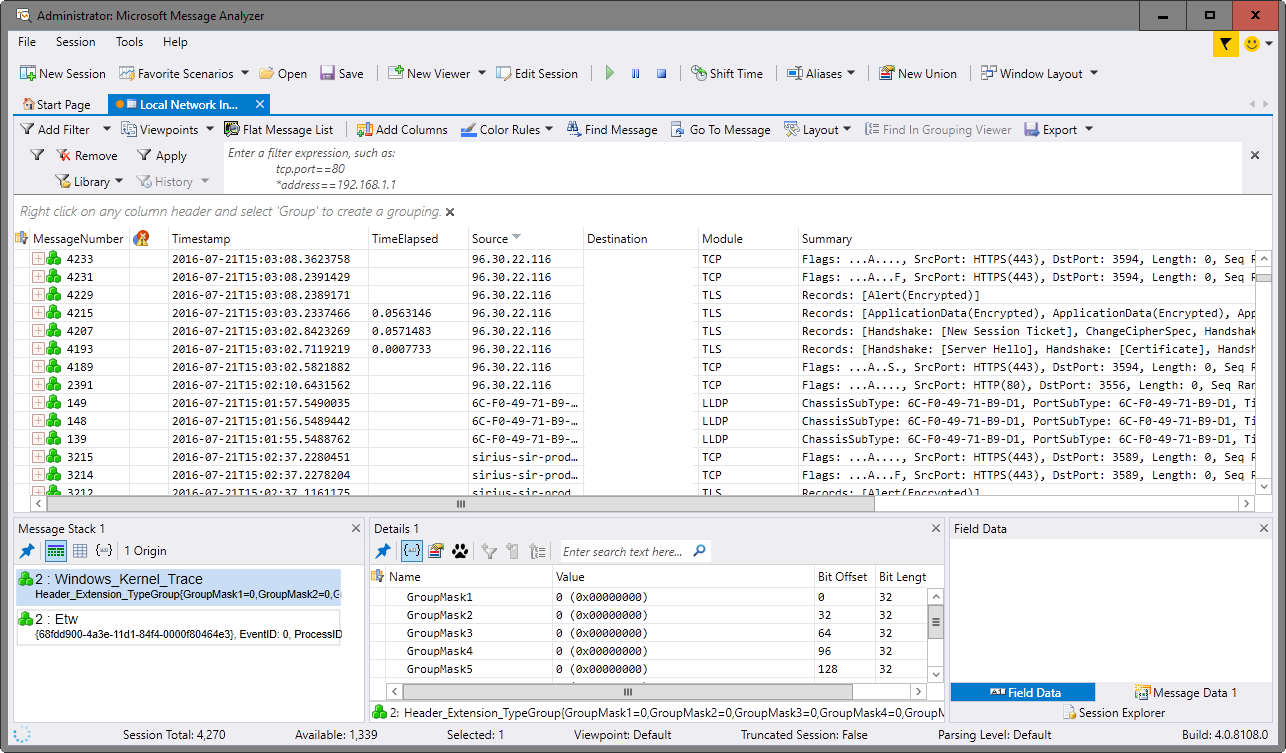
The program displays data in realtime as it is happening if you have selected to run a live capture. You may use filters at the top, or click on one of the column headers to sort the data accordingly.
A click on a message number displays lots of information about it in the lower panel. This may include the message stack, details, and field data.
You may customize the display, for instance by adding or removing columns, configuring color rules to highlight events, or switching to a different layout.
There is also a search built-in, and an option to jump to a specific message.
Message Analyzer Intro Video
Closing Words
Microsoft Message Analyzer is designed for network and system administrators. It is feature-rich and can be confusing at times, especially if you are just getting started.
It is recommended to go through the Microsoft Message Analyzer Operating Guide at least briefly as it provides you with a wealth of information.
All in all, this is a mighty program for Windows 7 and newer versions of Windows that admins and regular users may use for a variety of troubleshooting or diagnostic purposes.