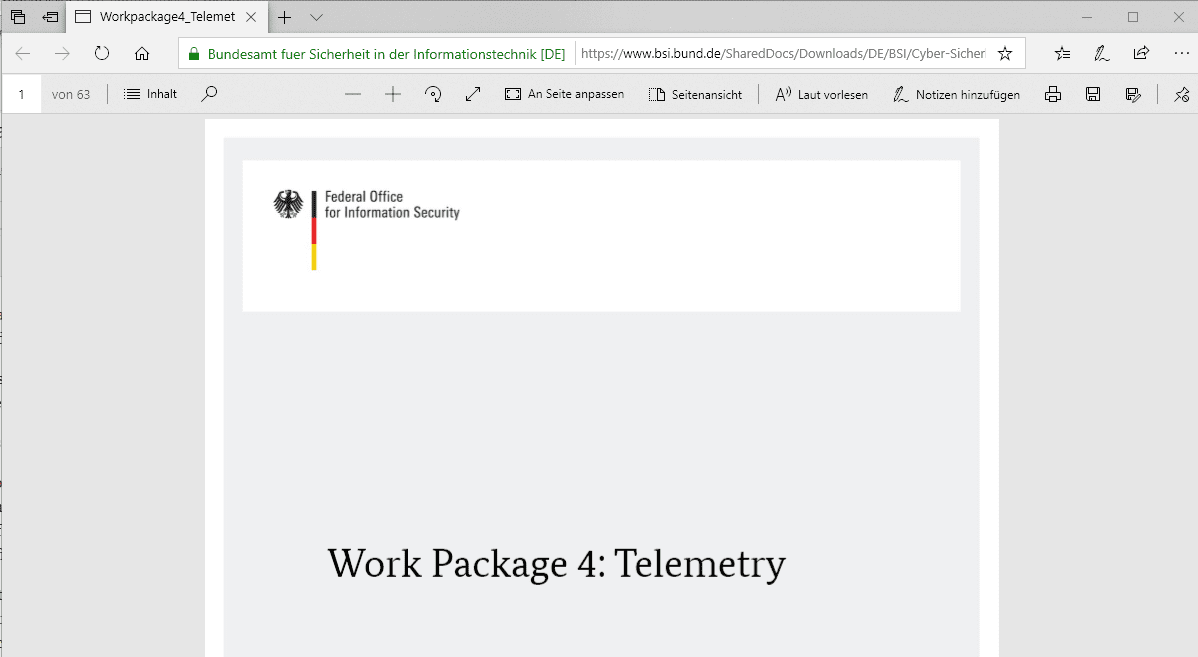
German federal office BSI publishes Telemetry analysis
The German Federal Office for Information Security, BSI (Bundesamt für Sicherheit in der Informationstechnik) published a detailed Windows 10 Telemetry analysis on November 20, 2018.
The research paper, which is available in English (partially) and German, provides a deep analysis of Telemetry functionality that Microsoft implemented in the company's Windows 10 operating system.

The paper is based on Windows 10 version 1607 Enterprise. It covers:
- An overview of Windows 10's event tracing functionality for Telemetry.
- A technical analysis on how Telemetry data is collected and processed.
- An analysis of the network interfaces and connections used to transfer Telemetry data.
- A look at configuration and logging capabilities to monitor and control Telemetry data collecting.
The report is quite technical in nature and the first couple of pages are only available in German at the time of writing. You may want to skip ahead to page 9, Executive Summary, if you don't understand German; the English part of the report begins with chapter 1.2.
Tip: An extra, German-only, paper is available that includes system-based and network-based options to limit or block the collection or transfer of Telemetry data to Microsoft.
You find interesting tidbits in the report even if you are not interested in technicalities like the number of Event Tracing for Windows (ETW) providers associated with Autologger-Diagtrack-Listener and Diagtrack Listener for each of the supported Telemetry levels:
- Security -- 9 and 4 ETW Providers
- Basic -- 93 and 410 ETW Providers
- Enhanced -- 105 and 418 ETW Providers
- Full -- 112 and 422 ETW Providers
The Security telemetry level is reserved to Enterprise editions of Windows 10. Home users may choose between Basic and Full, and the difference in providers is not as large as one would think based on the analysis.
The number of ETW Providers stands in no direct correlation to the amount of data that is collected or its quality according to the researchers.
The report list hostnames and IP addresses that Windows 10's Telemetry service uses for communication based on a connection log of 48 hours.
| Hostname | IP Address | Location |
| geo.settings-win.data.microsoft.com.akadns.net | 40.77.226.249 | Ireland, Dublin |
| db5-eap.settings-win.data.microsoft.com.akadns.net | ||
| settings-win.data.microsoft.com | ||
| db5.settings-win.data.microsoft.com.akadns.net | ||
| asimov-win.settings.data.microsoft.com.akadns.net | ||
| db5.vortex.data.microsoft.com.akadns.net | 40.77.226.250 | Ireland, Dublin |
| v10-win.vortex.data.microsft.com.akadns.net | ||
| geo.vortex.data.microsoft.com.akadns.net | ||
| v10.vortex-win.data.microsft.com | ||
| us.vortex-win.data.microsft.com | 13.92.194.212 | United States, Boston |
| eu.vortex-win.data.microsft.com | 52.178.38.151 | Netherlands, Amsterdam |
| vortex-win-sandbox.data.microsoft.com | 52.229.39.152 | United States, LA |
| alpha.telemetry.microsft.com | 52.183.114.173 | United States, LA |
| oca.telemetry.microsft.com | 13.78.232.226 | United States, Cheyenne |
Last but not least, there is an appendix that list external executable files. Not all of them are used for Telemetry purposes though.
Here is the entire listing:
| Executable | Description |
| %SystemRoot%\System32\telsvc.exe | No description available |
| %SystemRoot%\SysWow64\dtdump.exe | No description available |
| %SystemRoot%\SysWow64\RdrLeakDiag.exe | No description available |
| %SystemRoot %system32\RdrLeakDiag.exe | No description available |
| %SystemRoot%\system32\appidtel.exe | No description available |
| %SystemRoot%\system32\disksnapshot.exe | No description available |
| %SystemRoot%\system32\bcdedit.exe | A tool for managing the Boot Configuration Database (BCD); |
| %SystemRoot%\system32\dxdiag.exe | A tool for collecting information on devices; |
| %SystemRoot%\system32\dispdiag.exe | A tool for collecting and logging information on displays; |
| %ProgramFiles%\internet explorer\iediagcmd.exe | No description available |
| %SystemRoot%\system32\icacls.exe | A tool for displaying and modifying access control lists; |
| %SystemRoot%\system32\licensingdiag.exe | No description available |
| %SystemRoot%\system32\ipconfig.exe | A tool for displaying network information and configuring network settings |
| %SystemRoot%\system32\msinfo32.exe | A tool for displaying information about the hardware and software enviroment deployed on a platform; |
| %SystemRoot%\system32\logman.exe | A tool for configuring, and displaying information about, the ETW environment; |
| %SystemRoot%\system32\netsh.exe | A tool for displaying network information and configuring network settings; |
| %SystemRoot%\system32\netcfg.exe | A tool for installing the Windows preinstallation environment, a lightweight version of Windows; |
| %SystemRoot%\system32\route.exe | A tool for displaying and modifying the platform’s IP routing table; |
| %SystemRoot%\system32\powercfg.exe | A tool for configuring power settings (e.g., configuring the platform’s standby mode) |
| %SystemRoot%\system32\stordiag.exe | No description available |
| %SystemRoot%\system32\settingsynchost.exe | No description available |
| %SystemRoot%\system32\verifier.exe | A tool for detecting and troubleshooting driver issues; |
| %SystemRoot%\system32\tracelog.exe | A tool for managing ETW environment (e.g., activation and deactivation of ETW sessions); |
| %SystemRoot%\system32\whoami.exe | A tool for displaying information on the user currently logged on to the system; https |
| %SystemRoot%\system32\wevtutil.exe | A tool for managing the EventLog environment; |
| %SystemRoot%\system32\wscollect.exe | No description available |
Administrators and researchers may also be interested in a tools and script package that was released as part of the analysis.
Closing Words
The reports provide detailed Telemetry information that is useful to interested Windows users but especially to administrators who want to know more about how Telemetry works on Windows 10 devices.